Apple’s record second quarter in charts
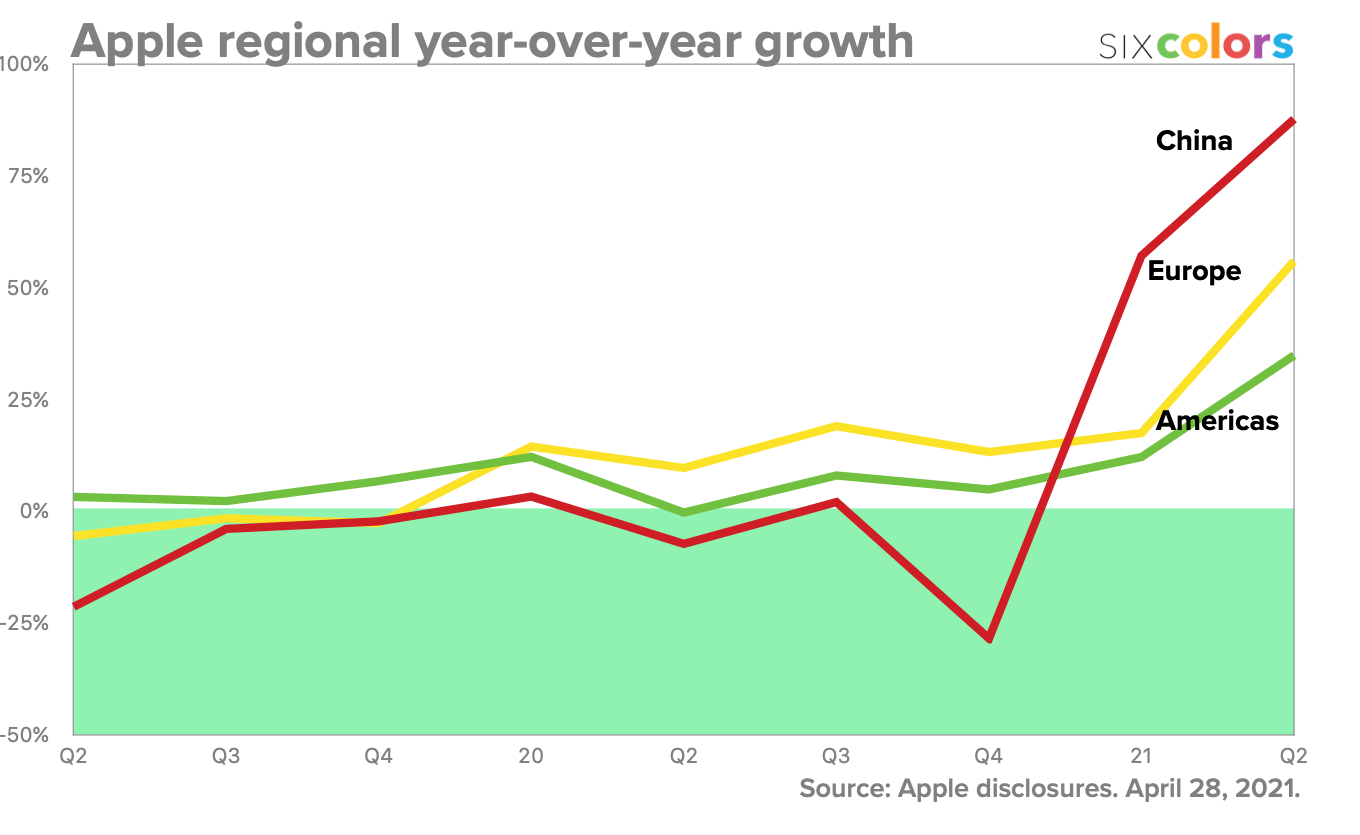
On Wednesday Apple announced the results of its fiscal second quarter of 2021 and the numbers are staggering. It’s Apple’s best non-holiday quarter ever, with all its major product categories way up versus the year-ago quarter.
Mac revenue was $9.1B, up 70% versus last year’s second quarter, and seems to be an all-time record for the Mac. iPad revenue was $7.8B, up 79% versus the year-ago quarter. iPhone revenue, which is typically pretty sleepy in the fiscal second quarter, was up 66% to $47.9B.
The flashy new revenue lines, Services and Wearables, turned in (relatively) modest jumps: Services made $16.9B, up 27%, and Wearables made $7.8B, up 25%. So modest.
Overall Apple’s revenue was $89.6B, which is only a couple billion less than its then-record quarter during the holidays of calendar-year 2019. It’s the third-largest Apple revenue quarter ever. Profit was $23.6B, making the last two financial quarters Apple’s two most profitable quarters ever.

More analysis to come; in the meantime, come for the pie chart but stay for the many bar charts.


